
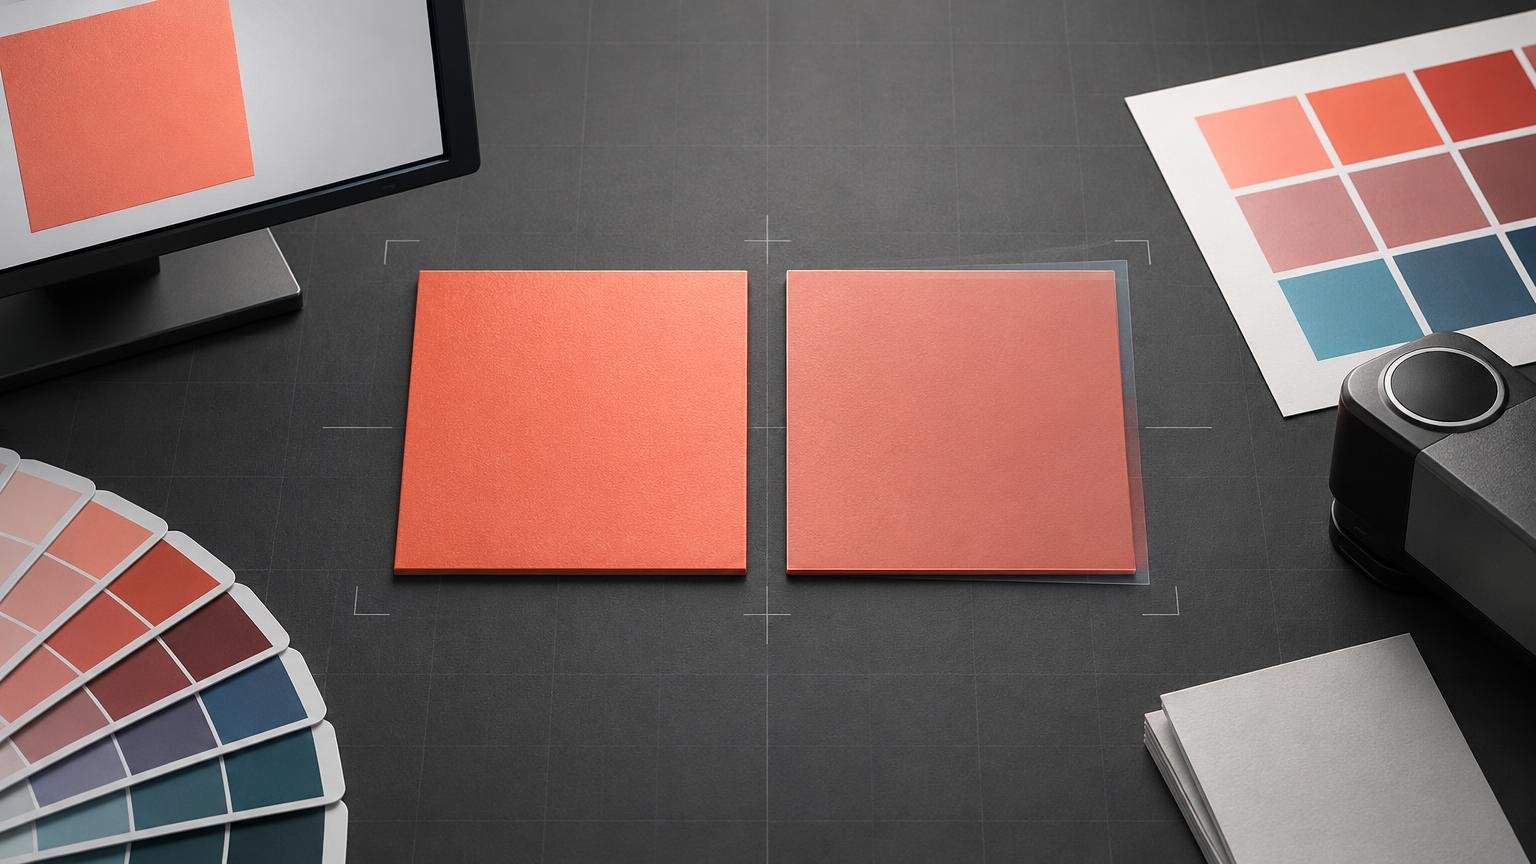
Delta E, written as ΔE, is a number that describes the calculated difference between two colors. A result of 0 means the calculation found no difference; a larger result means a larger color difference. In color-accuracy testing, one color is usually the intended reference and the other is the measured reproduction from a display, proof, or print.
The practical rule is simple: lower is closer, but a Delta E number is not meaningful on its own. You also need to know which Delta E formula was used, what reference the measurement was compared with, whether the result is an average or a worst case, and whether the tested colors matter to your work.
That context prevents a common mistake: treating Delta E as a universal quality score. It measures a particular color difference under defined conditions. It does not, by itself, tell you whether a display has enough gamut, whether a printer can reproduce the requested color, or whether the complete screen-to-print workflow is correctly configured.
What the Delta E number is comparing
A color-accuracy test begins with a reference. For a display, software may ask the screen to show a series of known color patches, measure them with an instrument, and compare the measured values with the calculated target values. The International Color Consortium also notes that the display white point should be recorded as part of this assessment. ICC color-management guidance
For a proof or print, the reference might be a characterization data set, a proofing condition, a measured physical sample, or a specified brand color. The measurement answers a narrow question: how far is this reproduced color from that reference according to the selected formula?
This means two reports can contain different Delta E results without contradicting each other. They may use different references, instruments, formulas, patch sets, white points, substrates, or viewing assumptions. Before comparing the numbers, confirm that the tests are measuring the same task.
Why the Delta E formula matters
Delta E is a family of calculations rather than one fixed calculation. Reports commonly identify ΔE76, ΔE94, or ΔE00. The last of these is also called CIEDE2000. These formulas weight color differences differently, so their results are not directly interchangeable. the CIE specification for CIEDE2000
| Notation | What it identifies | How to use it |
|---|---|---|
| ΔE76 or ΔE*ab | An earlier CIELAB color-difference calculation | Use it only with limits or comparison data defined for the same formula. |
| ΔE94 | A later formula with different weighting | Do not compare its values directly with ΔE76 or ΔE00 results. |
| ΔE00 or CIEDE2000 | A formula designed to correlate more closely with perceived relative color differences | Prefer it when the workflow or specification calls for CIEDE2000, and label it clearly in reports. |
CIEDE2000 was developed to improve agreement between calculated results and perceived relative color differences compared with earlier CIELAB-based calculations. That makes it useful, but it does not turn perception into a perfectly universal scale. The appearance of a difference still depends on the colors involved, their surroundings, the viewing conditions, and the observer’s task.
Whenever someone says a device has “Delta E of 1,” the immediate follow-up should be: which formula? A purchasing specification, calibration report, proofing tolerance, and production-control document should all state the formula. A threshold written for ΔE00 should not be silently applied to ΔE76 data.
How to interpret a color-accuracy report
Start with the formula and reference, then examine the distribution of errors. A single headline number can hide the difference between consistently close reproduction and a result with several large misses.
- Confirm the formula. Look for ΔE76, ΔE94, ΔE00, or CIEDE2000.
- Identify the reference. Determine whether the report compares against profile targets, characterization data, a physical sample, or another defined standard.
- Check the average. This summarizes the tested patch set, but it can conceal isolated problem colors.
- Check the maximum and high-error patches. A low average offers little comfort if an important logo color, skin tone, or neutral has the largest error.
- Review the patch set. A report is only representative of the colors it tested.
- Check measurement and viewing conditions. Display white point, brightness, ambient light, print substrate, surface finish, and illumination can affect the practical judgment.
- Evaluate the colors that matter to the job. A portrait workflow should pay particular attention to skin tones, while packaging may place more weight on brand colors. The ICC explicitly uses portrait work as an example of a task that can require different weighting.
For a hypothetical example, imagine that two calibrated displays have the same average ΔE00. Display A has small, evenly distributed differences. Display B reproduces most patches very closely but has one much larger error in saturated blue. The averages may look equally good, yet Display B is the riskier choice for a project built around that blue. The patch-level result changes the decision.
There is no single passing Delta E for every job
It is tempting to classify every Delta E result using a universal set of “excellent,” “acceptable,” and “bad” thresholds. That approach is too crude for color-managed work. The acceptable limit depends on the formula, output condition, measurement method, intended use, and contractual specification.
A photographer adjusting a portrait, a designer approving a corporate color, and a print operator monitoring a production run are solving different problems. A small difference in a critical neutral or skin tone may deserve more attention than a larger difference in a minor background element. Conversely, a strict brand-color requirement may justify a tighter local tolerance than the rest of the image.
Proofing standards make this context explicit. Fogra provides separate tolerance evaluations for proofing, validation printing, and production printing rather than one Delta E limit for every output. Fogra ProcessStandard Digital resources A contract proof also needs a defined reference condition and control process; it is more than a print that happens to look plausible.
Delta E is not the same as gamut
Delta E measures the difference between two color values. Gamut describes the range of colors a device or output condition can reproduce. These concepts interact, but they are not interchangeable.
A display can measure accurately for colors inside its gamut while being unable to show some highly saturated colors from a larger source space. Likewise, a printer may be well characterized and stable but still be physically unable to reproduce a requested RGB color on a particular ink-and-paper combination. The ICC recommends evaluating output-profile performance using colors within the reproduction medium’s gamut.
This distinction matters because an out-of-gamut color is not automatically evidence of poor calibration. The requested color may simply fall outside the output system’s capabilities. The practical response is to preview the conversion, choose an appropriate rendering strategy, and decide how the color should be brought into gamut.
A soft proof using the intended printer and paper profile helps reveal these compromises before output. It complements Delta E measurement: the soft proof predicts the appearance of a specific output condition, while Delta E quantifies differences between defined color values.
What Delta E can and cannot tell you about a display
A display verification report can show how closely measured patches match the selected calibration or profile targets. It can help identify a poor calibration, profile mismatch, or troublesome region of color. It cannot establish every aspect of display suitability from one average value.
Also review the white point, tone response, luminance, black level, patch-level maximums, and screen uniformity when those measurements are available. A display can produce a favorable central measurement while varying across the panel. It can also be colorimetrically close to its target yet remain too bright for dependable print comparison in the room where it is used.
For editing and print preparation, begin with a properly calibrated and profiled monitor. Verification should then compare the measured display against the targets you actually selected. If the report is poor, check the calibration settings, instrument placement, display controls, profile assignment, and measurement conditions before editing the image to compensate.
How Delta E fits into a print workflow
Print introduces variables that a display-only measurement does not cover: the printer, ink or toner, substrate, surface, output profile, rendering method, production stability, and viewing light. Delta E can quantify a proof or print against a defined reference, but the reference must match the output decision you are trying to make.
In a Photoshop-managed print workflow, Adobe recommends selecting the printer profile that matches the output device and paper. When Photoshop performs the conversion, printer-driver color management should be disabled to avoid a second conversion. Adobe’s Photoshop printing guidance
Adobe’s soft-proofing workflow likewise uses the relevant output profile and can simulate paper white or identify out-of-gamut colors. These steps do not guarantee that every requested color can be printed. They align the preview and conversion with a known output condition, which makes later measurements and comparisons more meaningful.
If you are choosing a physical product before requesting a proof, Printiverse custom printing and print-product options can help define the item and production route. Then ask the producer for the profile, proof type, reference condition, and color tolerances relevant to that exact process.
Why a visually different print may still need more than a Delta E check
A print can look different from its screen preview even when both systems are behaving normally. A screen emits light, while a print reflects the illumination falling on it. Paper white, surface reflections, display brightness, and room lighting all influence the comparison.
If the whole print looks darker than the screen, start by checking display luminance, the output profile, and print-viewing light rather than making a blanket brightness adjustment to the file. The workflow in why prints look darker than screens addresses that mismatch directly. Delta E measurements can support the diagnosis, but they do not replace a controlled viewing setup.
The practical next step
When you encounter a Delta E claim, do not decide from the headline number alone. Ask for the formula, reference, average, maximum, patch set, and measurement conditions. Then identify the colors that carry the most visual or commercial importance in your project.
For display work, calibrate and profile first, verify against the chosen targets, and inspect both average and worst-case results. For print, use the correct output profile, soft proof the conversion, evaluate gamut limitations, and approve color under defined viewing conditions. For contract or production acceptance, use the tolerance specified for that exact process rather than importing a generic threshold from another report.
Delta E is most useful as a diagnostic and acceptance tool: it tells you how closely a measured color matches a defined target. The color decision becomes reliable when that number is tied to the right formula, the right reference, and the actual screen, proof, or final output you need to approve.